
My first Earthquake
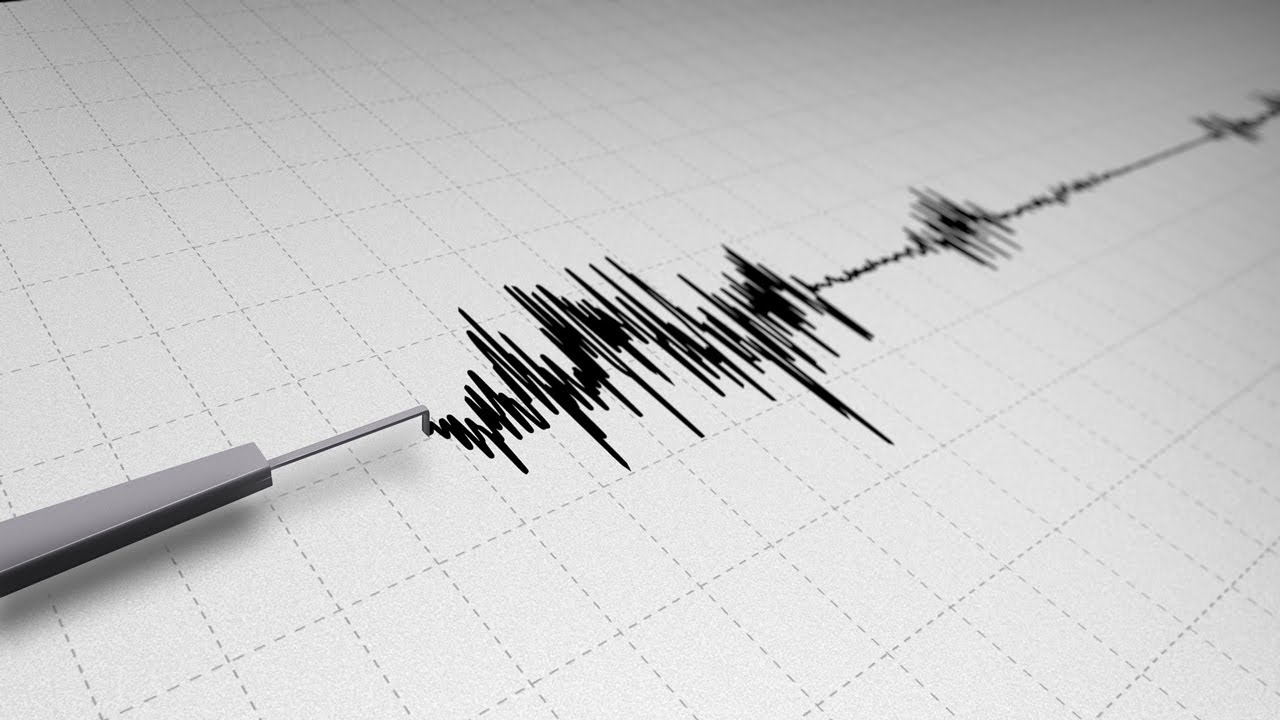
January 4, 2018. It was late night at Stanford when an Earthquake gently woke me up. In this post, I would like to share how I used open data and GeoStats.jl to estimate Earthquake magnitude at my home address.
Data
The data provided by USGS comprises measurements from 519 seismic stations in California. Besides the measurements, USGS provided estimates of Earthquake magnitude and uncertainty as raster images:
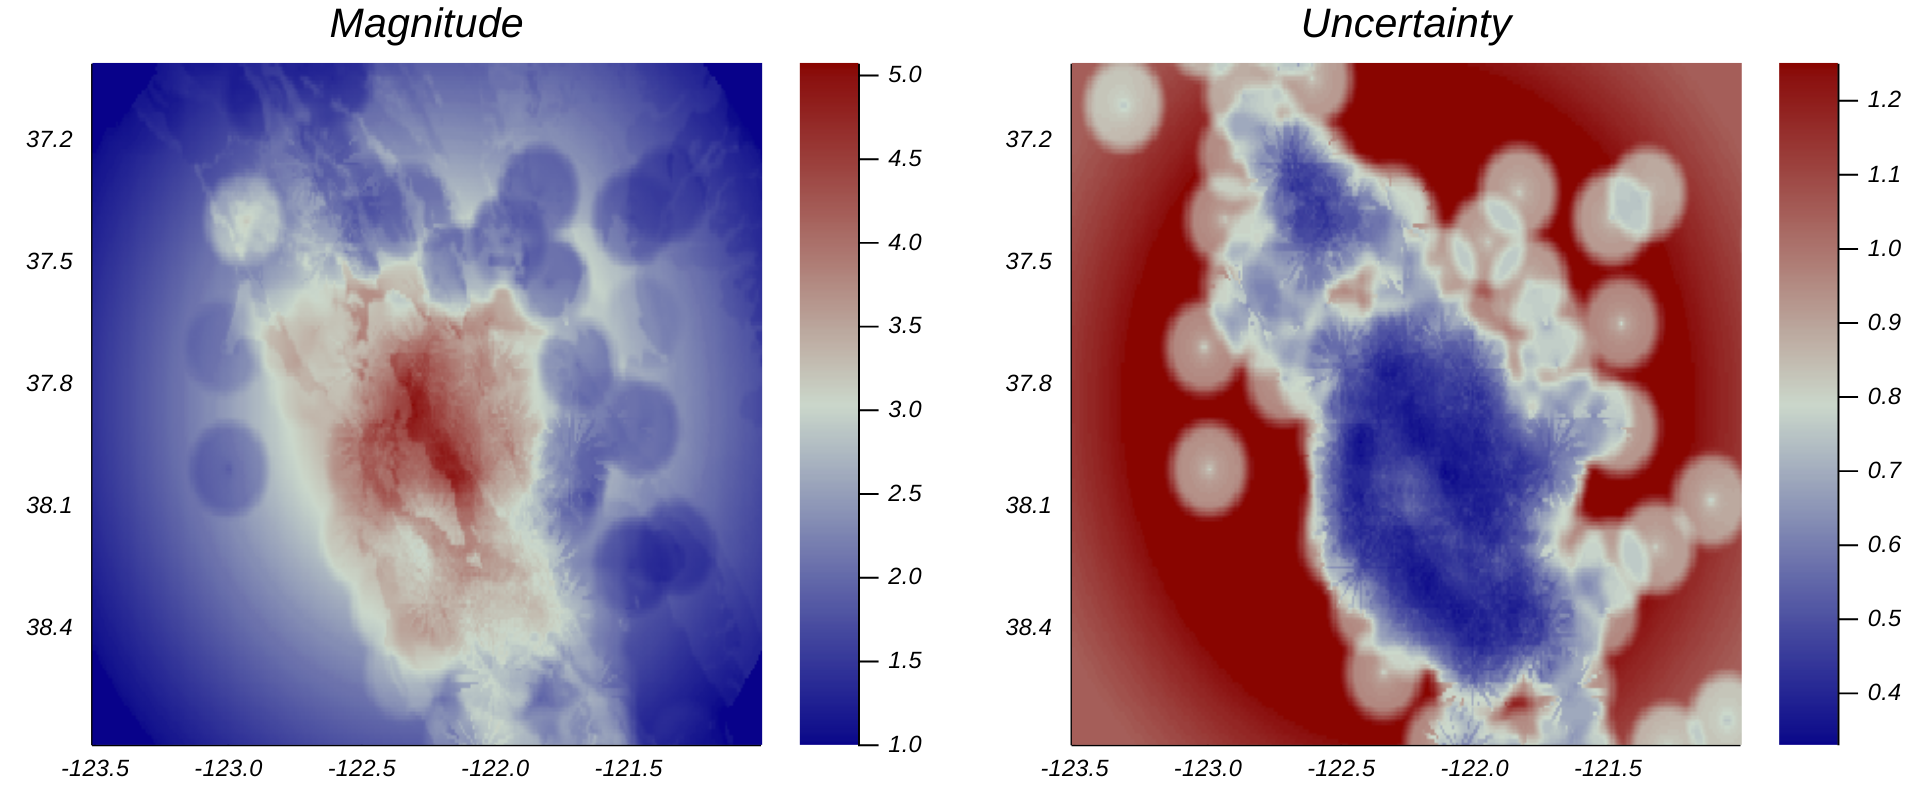
Their estimation procedure, which is explained in the metadata, was designed to preserve ground motion information near monitoring stations to the best extent possible. Locations that were far away from the epicenter at Berkeley were penalized, and as a result, many “bubble” artifacts were printed on the map.
I wasn’t particularly happy with the visualization, and so I decided to create my own map using
open source software. ![]()
Preprocessing
Raw measurements from all 519 stations were extracted from the KML files, and the data was saved into a single CSV file:
$ head stations.csv
longitude,latitude,magnitude,station
-116.711900,33.714100,1.0,"Keenwild Fire Station, Mountain Center, CA, USA"
-116.459400,33.611700,1.0,"Pinyon Flats Observatory, CA, USA"
-116.847800,33.630000,1.0,"Red Mountain, Riverside Co, CA, USA"
-122.952698,38.823601,1.0,"Hale Ranch"
-122.702583,38.775879,1.0,"Engles Strong Motion"
-122.235580,37.876220,2.9,"Byerly Seismographic Vault, Berkeley, CA, USA"
-122.243180,37.874920,4.1,"LBL Building 67, Berkeley, CA, USA"
-122.254290,37.877150,4.2,"LBL Building 88, Berkeley, CA, USA"
-120.386510,38.034550,1.0,"Columbia College, Columbia, CA, USA"
Problem definition
The data was loaded into a GeoDataFrame:
using GeoStats

geodata = readtable("stations.csv", coordnames=[:longitude,:latitude])

# 519×4 GeoDataFrame (longitude and latitude)
# longitude	latitude	magnitude	station
# 1	-116.712	33.7141	1.0	Keenwild Fire Station, Mountain Center, CA, USA
# 2	-116.459	33.6117	1.0	Pinyon Flats Observatory, CA, USA
# 3	-116.848	33.63	1.0	Red Mountain, Riverside Co, CA, USA
# 4	-122.953	38.8236	1.0	Hale Ranch
# 5	-122.703	38.7759	1.0	Engles Strong Motion
# ...
and the estimation problem was defined for the area of interest:
minlon, maxlon = -123.5068, -121.0068
minlat, maxlat = 37.0219, 38.6885

domain  = RegularGrid([300,200], [minlon,minlat], [.0083,.0083])
problem = EstimationProblem(geodata, domain, :magnitude)

# 2D EstimationProblem
#   data:      519×4 GeoDataFrame (longitude and latitude)
#   domain:    300×200 RegularGrid{Float64,2}
#   variables: magnitude (Float64)
Solution
The problem was solved using Universal Kriging with a spherical variogram model. The model is simplistic for this cyclostationary process, but it serves as an example:
# variogram model from variogram analysis
γ = SphericalVariogram(sill=2.90, range=2.00, nugget=0.10)

# Universal Kriging with quadratic drift
solver = Kriging(:magnitude => @NT(variogram=γ,degree=2))

solution = solve(problem, solver)

# 2D EstimationSolution
#   domain: 300×200 RegularGrid{Float64,2}
#   variables: magnitude
The solution was then plotted on top of a basemap provided by Mapbox via the MapTiles.jl package:
using MapTiles

provider = MapTiles.MapBoxProvider(accesstoken=ENV["MAPBOX_AUTH"], id="dark")
basemap  = MapTiles.fetchmap(minlon, minlat, maxlon, maxlat, provider=provider)

plot(basemap)
heatmap!(solution, alpha=.4)
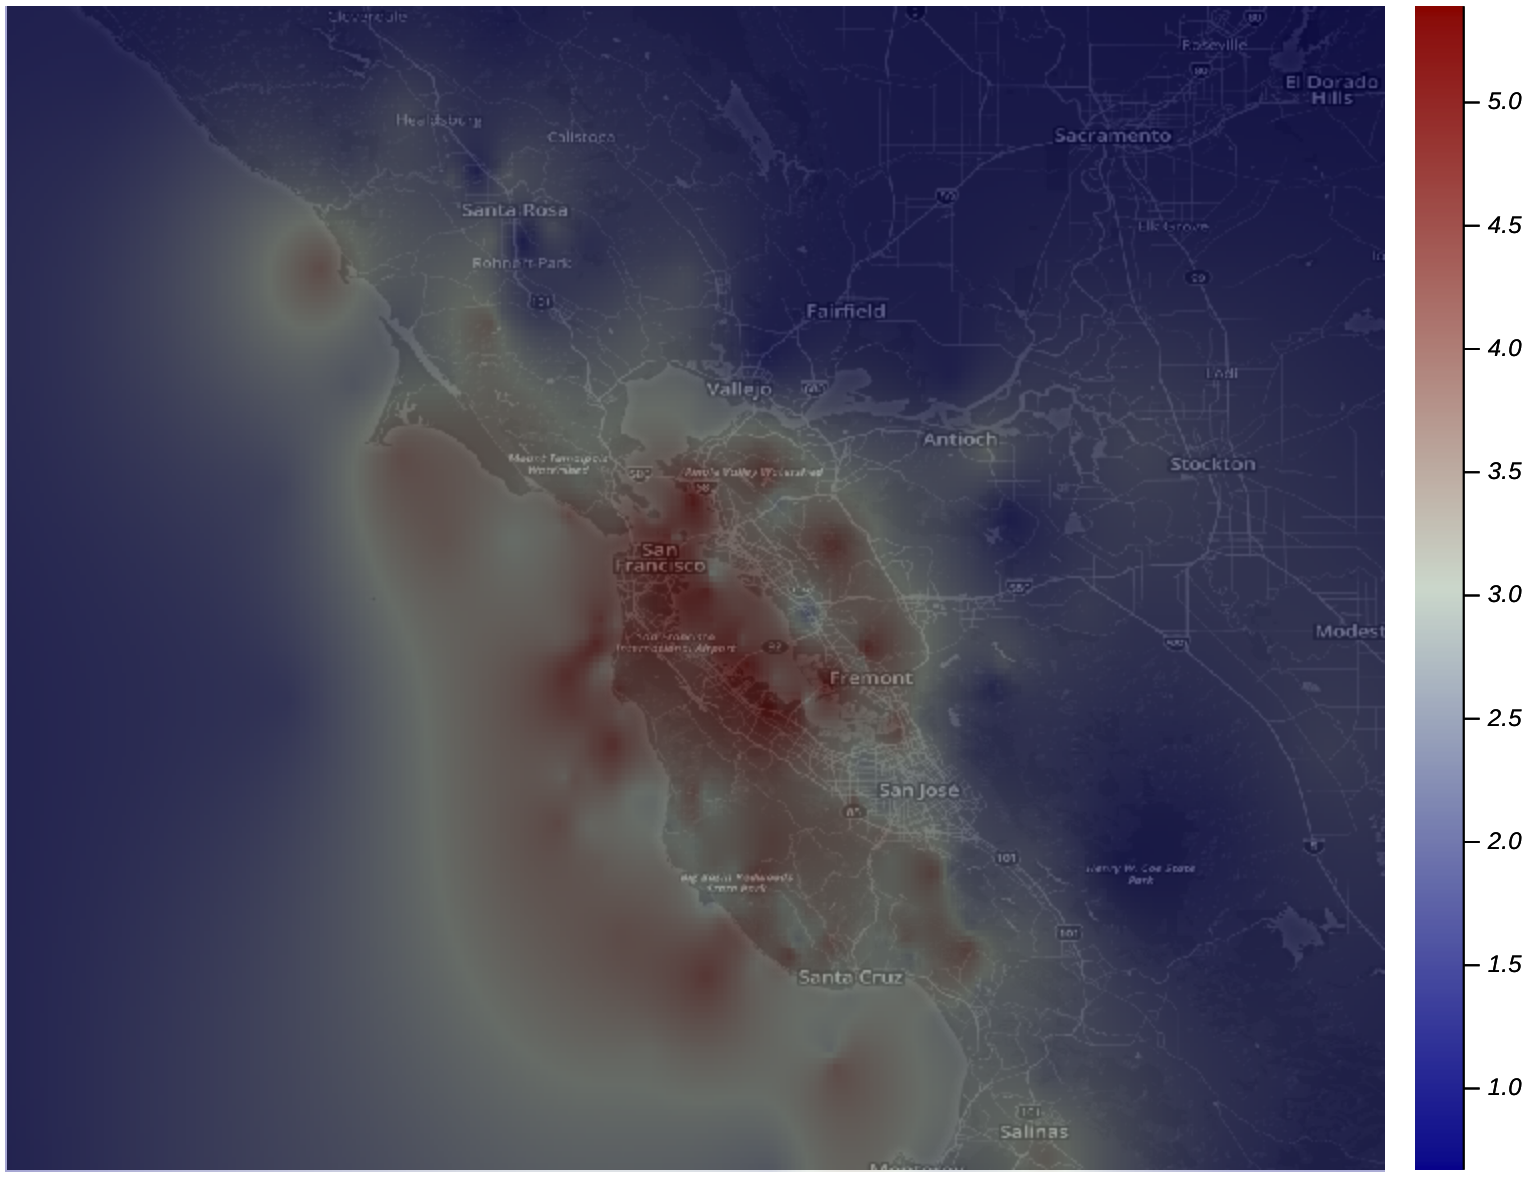
Great! I like this visualization better. ![]() Now let’s go back to the original question:
what is the magnitude of the Earthquake at a speficic location?
Now let’s go back to the original question:
what is the magnitude of the Earthquake at a speficic location?
To answer the question, we change the domain from a RegularGrid to a PointCollection
containing a few locations of interest, and solve the problem:
# locations of interest
UCBerkeley = [-122.268093, 37.872051]
Stanford   = [-122.169525, 37.428890]

domain  = PointCollection([UCBerkeley Stanford])
problem = EstimationProblem(geodata, domain, :magnitude)

solution = solve(problem, solver)

solution.mean[:magnitude]

# 2-element Array{Float64,1}:
#  4.62765
#  3.73319
I felt a magnitude of \(\approx 3.73\) whereas people in UC Berkeley felt a more intense Earthquake as expected with a magnitude of \(\approx 4.63\).
Leave a Comment